How to use Results
Results is divided into three main sections:
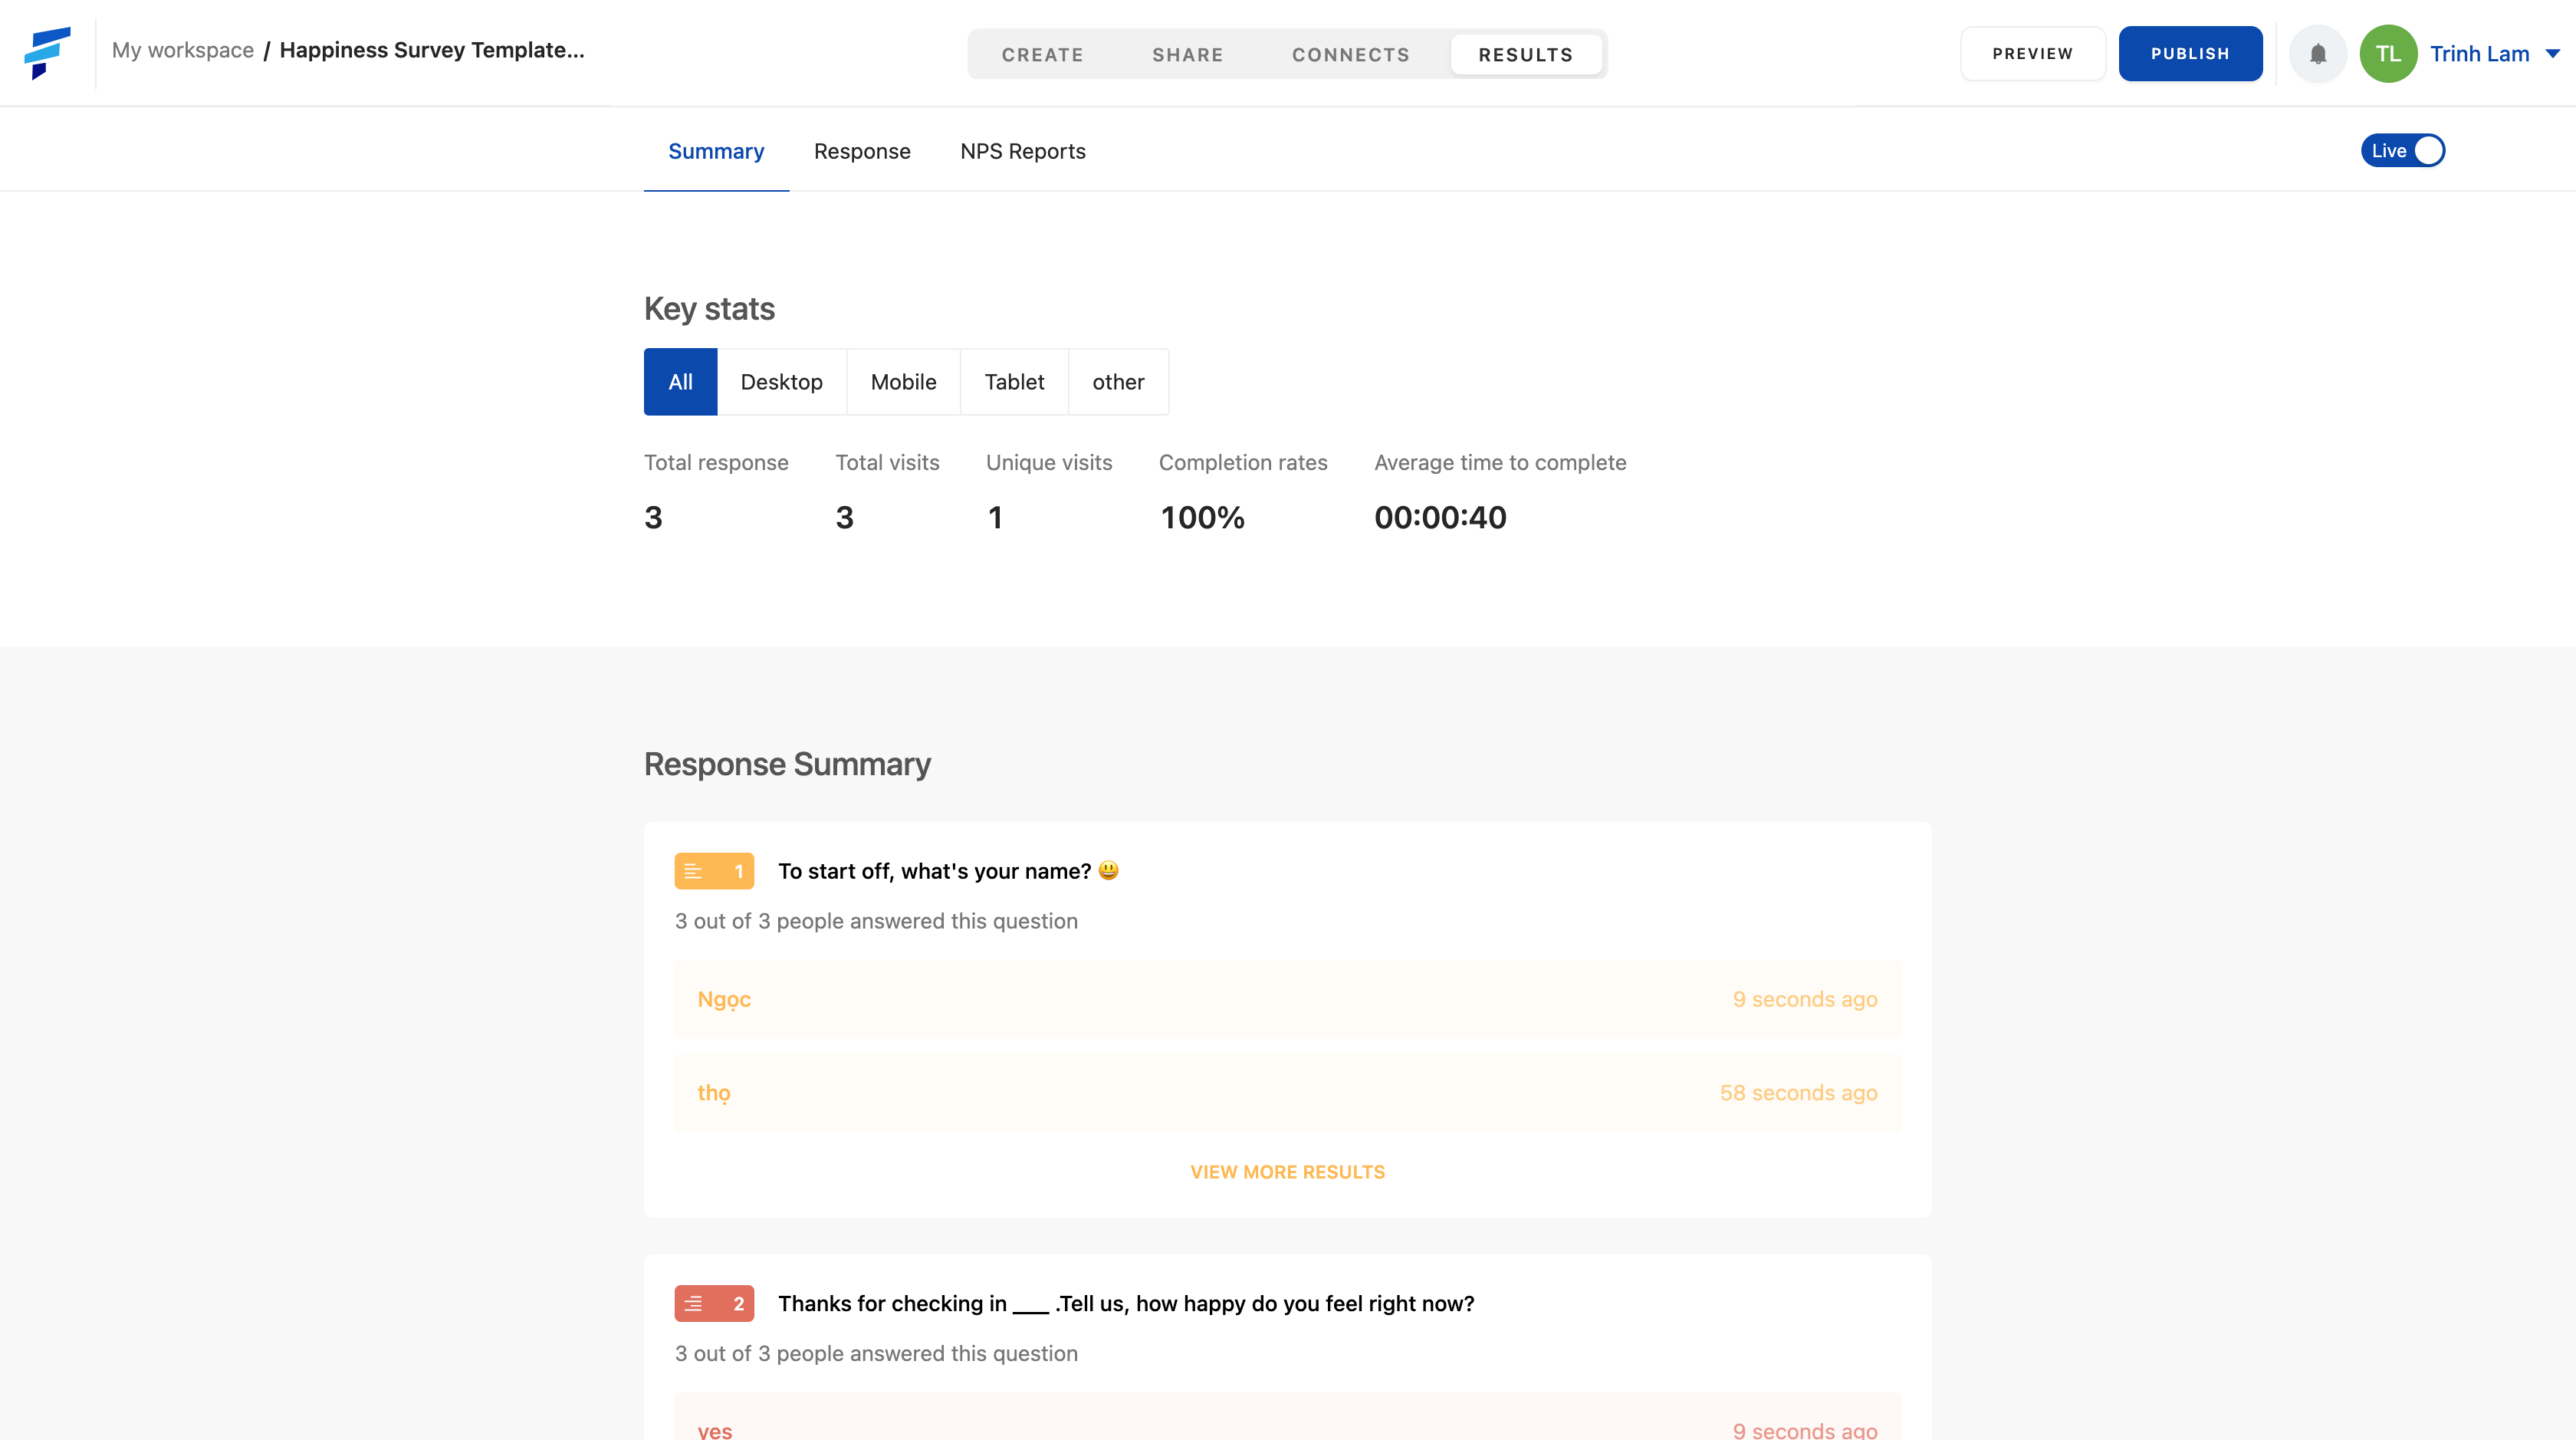
1. Summary:
The information displayed is broken down by the user platforms to fill out your form: All, Desktop, Mobile, Tablet, and other.
You'll get an overview of user filling form metrics:
- Total responses: the total number of forms filled out.
- Total visits: total number of form visits.
- Unique visits: the actual number of people visiting the form.
- Completion rates: how much people completed the form.
- Average time to complete: the average time it takes a person to fill out the form.
For a closer look at each answer answered, you can refer to the Response Summary.
 2. Response:
You'll find the specifics of each response here.
There are three ways to find the answer:
- Search through the date the form was filled in by selecting the date you want to view on the list on the left.
Or through filling in the time period you want to see.
- Find the Question Type you want information about by selecting it from the drop-down list.
- Search specifically for the answer.
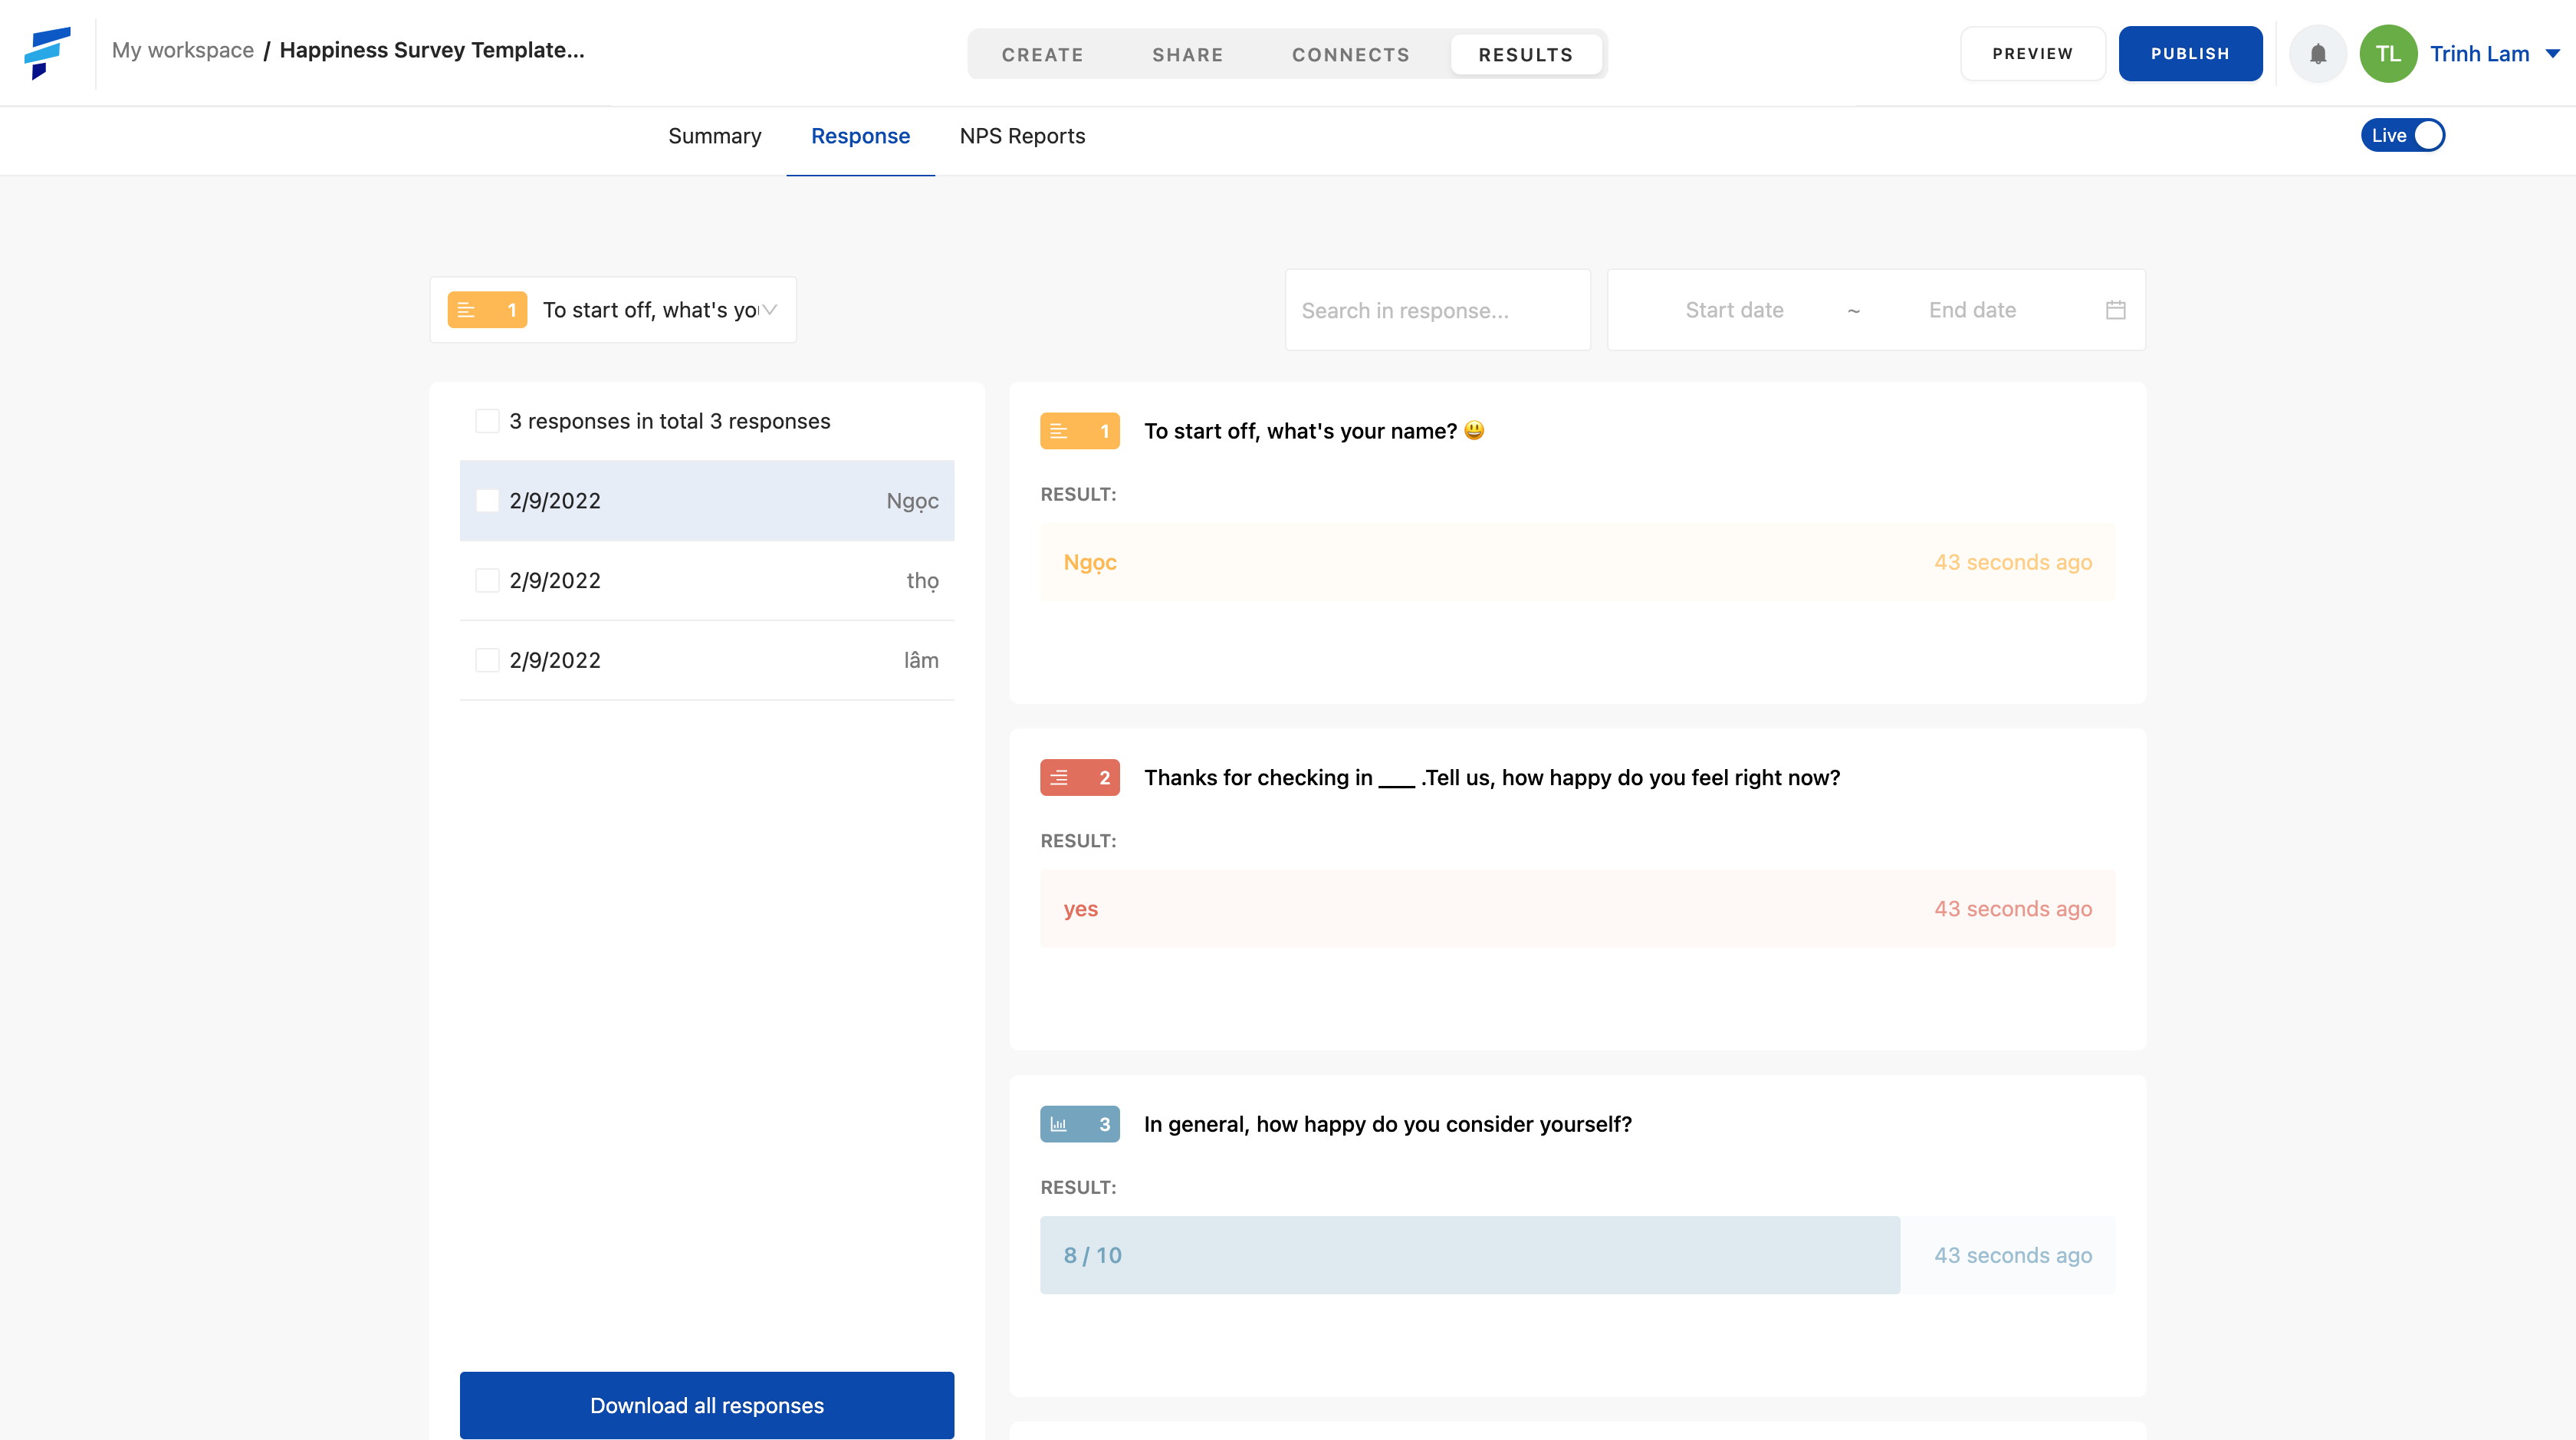
You can download all responses by selecting Download all responses.
Or choose to download data for each day by checking the box to select specific dates in the list and selecting Download "x" selected answers.
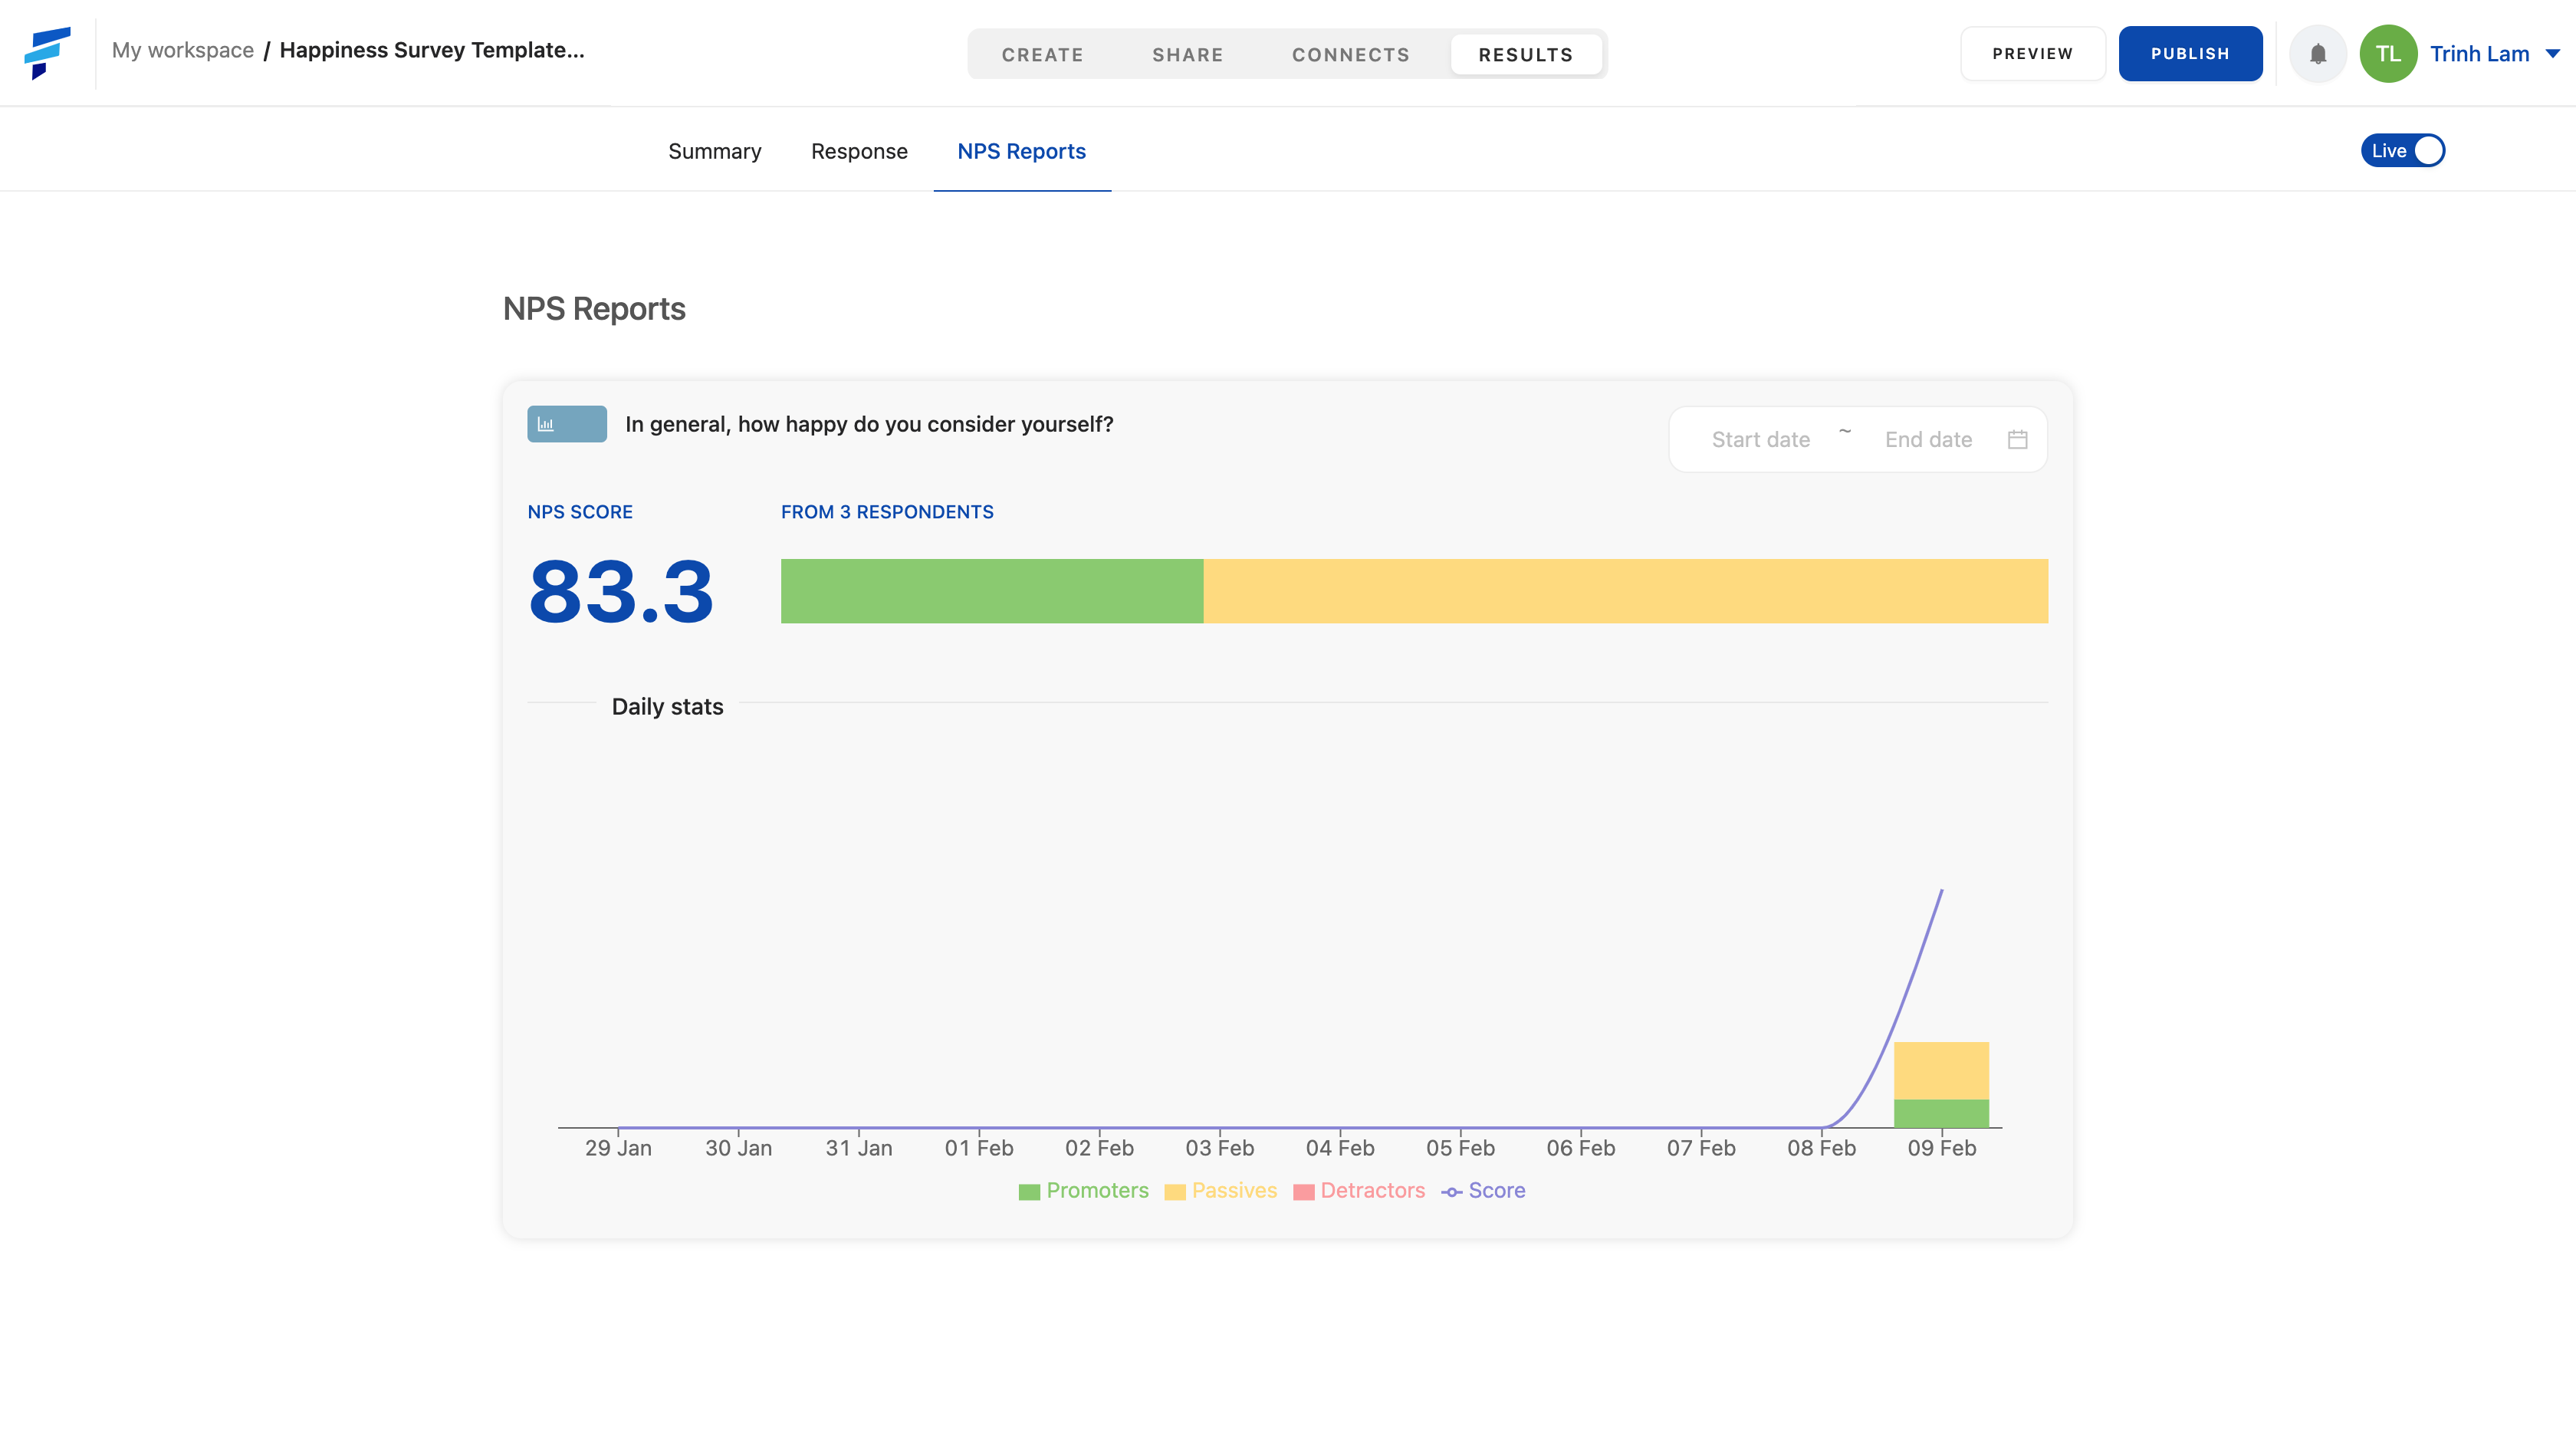
3. NPS report:
The report only displays parameters when in your form the NPS feature is enabled, the NPS feature is integrated into the form Opinion scale question, you can read more about the feature here.
You can clearly see the tendency of choosing the answer in the Opinion Scale question of respondents on the range of values of certain time periods through the graph.
You can get a more specific look at answer selection trends by selecting a certain time period through selecting the specific time period you want to see.